Introduction
The recommendations in this document were compiled by Aplura‘s staff over their many years of Splunk administration and professional services engagements. Many of these items come up time and time again during engagements and consideration of these items will result in a more successful implementation. A successful implementation is one that is efficient, scalable, follows information security best-practice, and is, most importantly, useful.
Although everything here is valuable, some of it does not apply for very small or specific implementations of Splunk. Largely, most of this applies to most environments we see.
Common Splunk Topologies
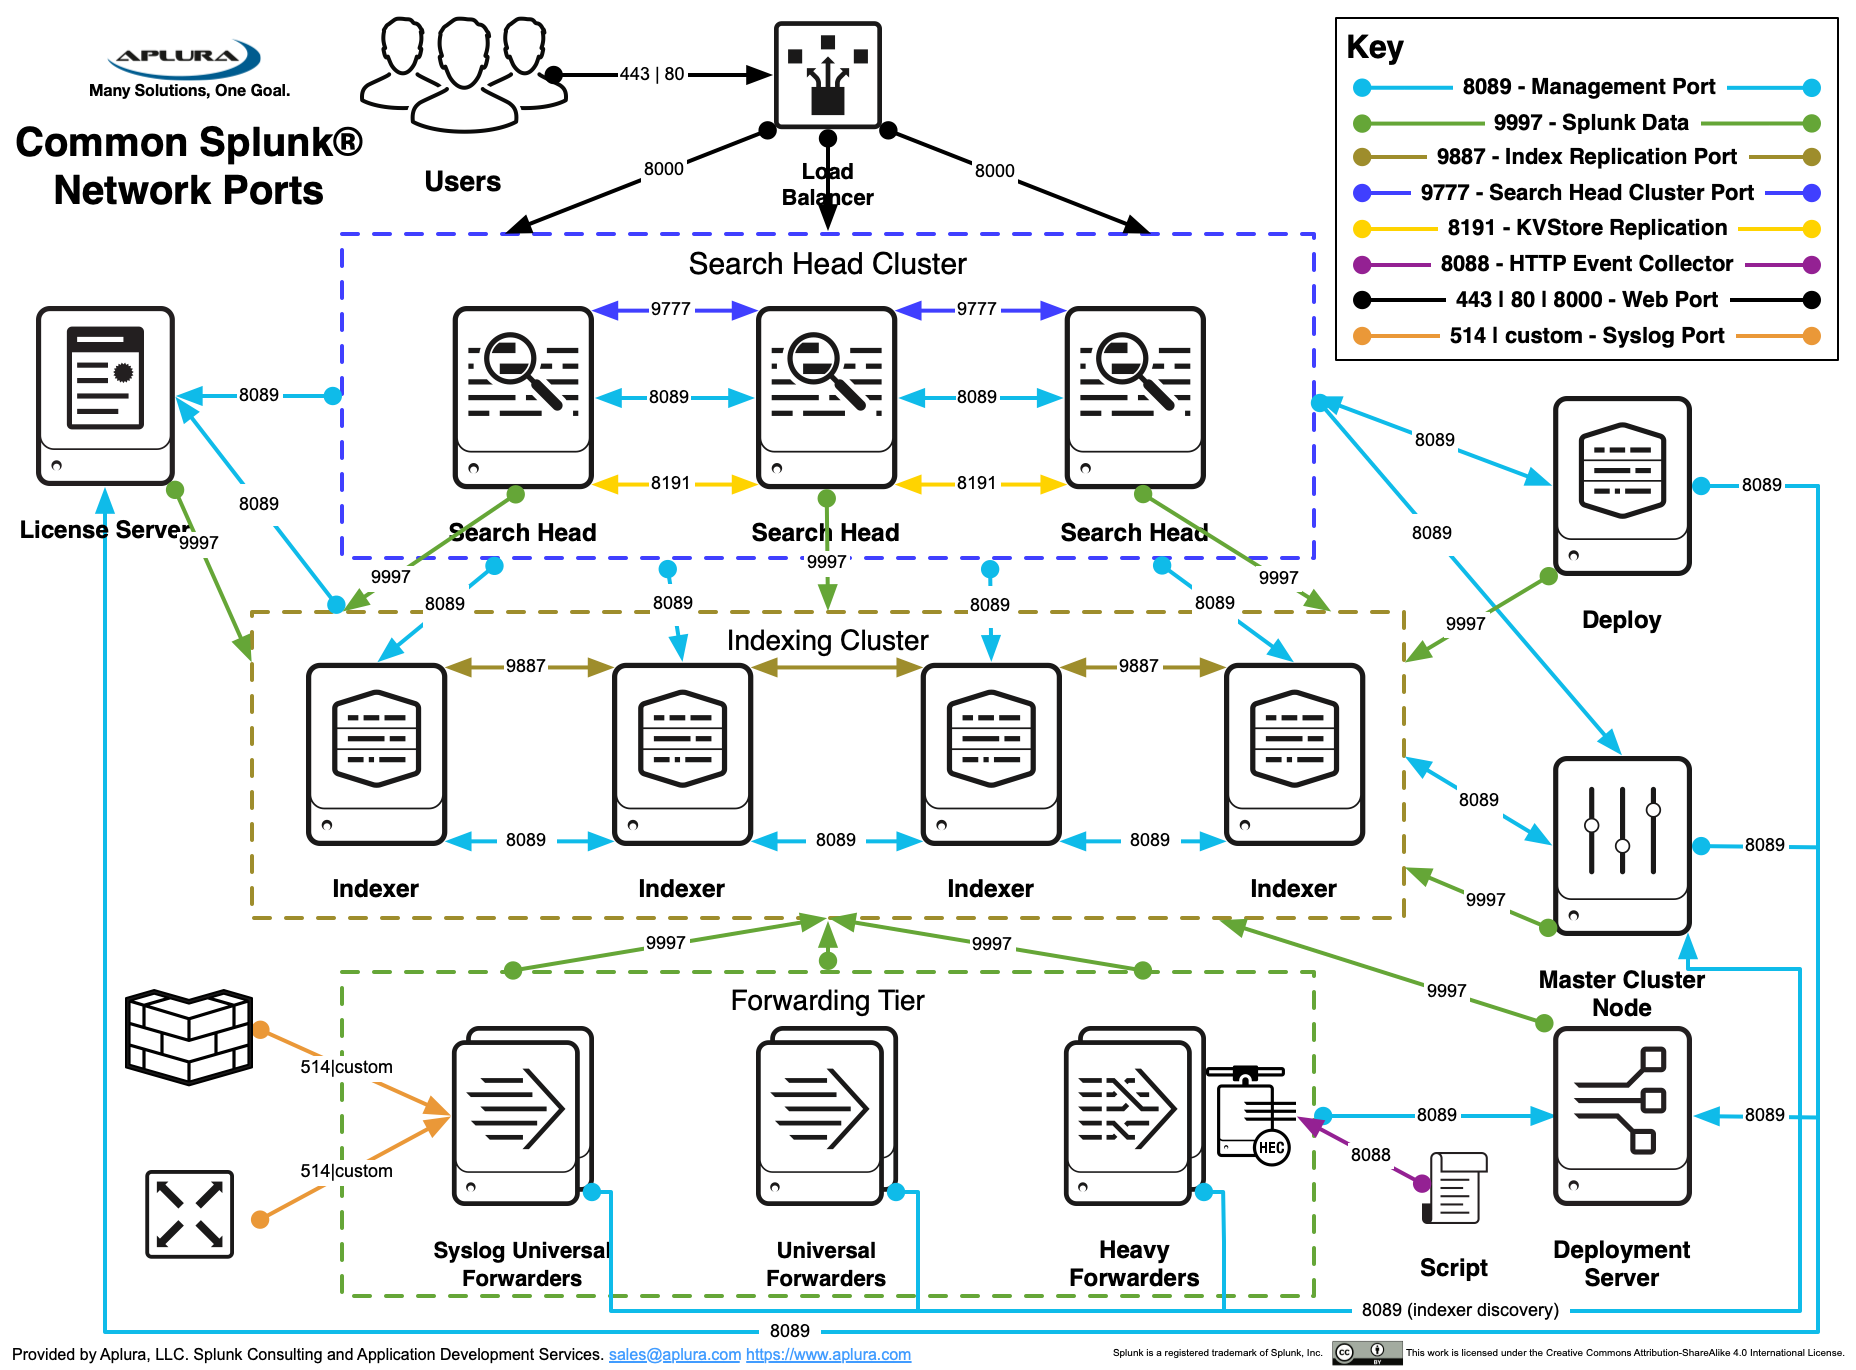
This architecture has several key components such as:
-
An indexer tier with indexer clustering. Multiple clustered search-peers (indexers) improves performance both during data-ingest and search. This strategy reduces search time and provides some redundancy of data-ingest and availability should a single server fail
-
One or more separate search heads. This separate system will distribute any search request across all configured search-peers improve search performance.
-
A separate search head is shown here to support Splunk’s Enterprise Security (ES) application
-
Deployment Server. This system can be collocated with other Splunk services, or stand-alone. For large deployments, a stand-alone system is important. This system typically acts as the License Master.
-
Master Node. This system is typically co-located with the Deployment server. For large deployments, a stand-alone system is important
Architecture and Design
-
Plan indexes and sourcetypes. These two things will be difficult to change later. Indexes and sourcetypes assist in data management. See Defaultfield and [Indexed Fields(https://docs.splunk.com/Documentation/Splunk/latest/Data/Configureindex-timefieldextraction)].
-
Use sourcetypes to group data by their similarity. If the events are generated by the same device and are in the same format, they should most likely be one sourcetype. See this great blog-post on Sourcetype naming.
-
Try to collect events as close (in terms of geography and network location) as possible. These events can be collected with a Splunk Universal Forwarder, and then sent to indexers which may be a central location.
-
Try to keep search heads as close to indexers as possible. This will improve the search head’s speed in accessing the events.
-
Use separate IP addresses whenever possible. Such as: management, log collection, web UI/search head and use separate IPs for different major sourcetypes. All of this makes your Splunk deployment more extensible, provides better access control options, and allows for fine-grained troubleshooting and analysis.
-
Use a consistent naming scheme on the Splunk Search Heads, Indexers to ensure accuracy and reduce troubleshooting time.
-
Carefully plan the deployment of Windows event collection (Event logs and Performance data) to ensure success. Many Windows event collection tools have various limitations such as the truncation of events at 512 or 1024 bytes. The Splunk Universal Forwarder doesn’t have these limitations and can be used to reliably and efficiently collection Windows events from a large distributed Enterprise.
-
We strongly recommend using Splunk_TA_Windows.
-
For very in depth logging on critical systems, consider using the Splunk addon for Microsoft sysmon in addition to Splunk_TA_Windows.
-
-
Single team accountability. A single team should be responsible for Splunk instead of having this split across multiple departments, divisions, or entities. Additionally, much of the deployment of Splunk requires an intimate understanding of its intended use and therefore it is recommended that the team who will be the major user of Splunk should also manage its deployment. This generally equates to a more successful implementation.
- Use a License Master to control the licensing of your indexers and don’t forget to include you search heads and any heavy/full forwarders in that license.
-
If you are in a distributed deployment, with multiple Splunk search heads and forwarders, strongly consider using Deployment Server. Using deployment server can help keep consistent configuration across Splunk systems, and make configuration changes much easier (no having to touch every system).
-
When deploying Indexers, strongly consider indexer clustering. Even when starting with one Indexer, starting with a master node to manage configurations on that indexer will ensure expanding to a multiple indexer setup is painless.
-
Carefully and consistently use Splunk’s listening ports, which bind to specific back-end processes. Some of these are referenced when Splunk starts. Generally speaking here are the standard ports, if they have not been altered:
| Port (TCP) | Function | Description |
|---|---|---|
8089 |
splunkd |
Splunk’s daemon port used for distributed search and deployment server. |
8000 |
splunkweb |
Splunk’s web port used for web UI access. |
8191 |
kvstore |
Splunk’s key value store. |
9887 |
Index cluster replication |
Port commonly used to replicate Splunk data in index clustering environments. NOTE: This can be any permissible port, 9887 is just an example. |
9997 |
splunktcp listener |
Port commonly used to send events from a Splunk forwarder to a Splunk listener (indexer or another forwarder). NOTE: This can be any permissible port, 9997 is just an example. |
9998 |
splunktcp SSL listener |
Port commonly used to send events from a Splunk forwarder to a Splunk listener (indexer or another forwarder) using encryption. NOTE: This can be any permissible port, 9998 is just an example. |
-
Perform integrity checks. Splunk is incredibly precise in how it collects and represents your data; however, if you send it bogus or duplicate data it may index this as well. Occasionally review your inputs and ensure your data is accurate, time stamps are good, and there are no mistakes such as incorrect or duplicated events.
-
Integrate Active Directory (AD) for authentication. Splunk integrates fairly well with Active Directory to authenticate users. This configuration allows you to assign a user to a group in AD then map this group to a role in Splunk. When this user logs in to Splunk, they are given their specific capabilities and rights assigned by the role. This is granular Role Based Access Controls (RBAC). The Microsoft AD tool adsiedit.msc is great to browse an AD domain for valuable items necessary to setup AD auth on Splunk. This tool is installed by default on 2008 AD systems, but would need to be installed manually as part of the RSAT package on other versions of Windows.
-
Use a separate OU for Active Directory Integration. When configuring AD, you can specify a list of one or more bindgroupDN for Splunk to look for groups in AD. If you just give the root dir of all of the groups then Splunk could return hundreds/thousands of Groups. Additionally, if leveraging existing groups there could be many other users in that group that you don’t want to have access to Splunk. If you created a new base_ou (e.g.
OU=splunkgroups) in AD, then create your access groups under this, e.g. (OU=unix_admins,OU=splunkgroups, OU=network_admins,OU=splunkgroups), then you can set thebindgroupDNtosplunkgroupsto minimize returned groups as well as users who have access to Splunk. -
Migrating Index Data. This can be very tricky and you need to be careful since you could destroy and disable your data. It is advised that you call Splunk support or have PS help you. If you must do this manually, read and understand the docs and how the bucket structure works, and you can take a look at this answers post on the subject.
-
Consider the implications of parsing data directly on your Indexers or using Intermediate Heavy Forwarders. In Splunk 6.2, there were a number of improvements to what will require a restart on the Indexers, and Indexer Clustering reduces this even further. In general, Heavy Forwarders are discouraged for anything other than using apps or APIs to bring in data.
-
Moving away from Heavy Forwarders reduces the amount of systems to manage.
-
No Heavy Forwarders means you always know where your data is being parsed (the Indexer).
-
In very specific use-cases, Heavy Forwarders can still provide value. When doing an extreme amount of parse-time operations on data, such as large amounts of Index, Host, and Sourcetype renaming, a Heavy Forwarder may be used to reduce CPU load on Indexers. In general this is not required and only complicates deployments.
-
-
In situations where remote offices are bandwidth limited or may have un-reliable network connections, consider using an Intermediate Universal Forwarder. This will reduce the number of connections on a bandwidth-limited link, as well as give better control over rate limiting if desired.
Hardware
To spec out hardware with Splunk requires more than just a quick guide, but the following list may help you to get started. This is not intended to replace a scoping discussion with a Splunk Sales Engineer, but rather to assist a customer in preparation for a professional services engagement.
-
Splunk hardware planning. Answering these three questions will suffice for the average deployment, but not all deployments.
-
Splunk hardware planning: Know what the size/scope of your deployment is. You must know the amount you expect to index/day. Additionally, you should have a rough idea of how many Splunk users there will be, and what their intensity/usage will be. Finally, you should understand your data sources and either their load/volume or the complexity required to collect data from them.
-
Splunk hardware planning: Determine what components you need. Read about Splunk components to better understand what exists. In general, most deployments would benefit from having the following:
-
(1+) Search Heads
-
(2+) Indexers
-
(1+) Deployment Server / Master Node
-
-
Splunk hardware planning: Determine number of indexers. According to Splunk’s Documentation, a single indexer can accommodate up to about 300GB/day. If you are processing 100GB/day of data volume for use with Enterprise Security, you will need approximately 340GB more space available across all of the indexers to allow for up to 1 year of data model retention and source retention. An indexer, when used in an ES deployment, can accommodate up to 100GB/day. Also note that newer versions of ES (starting with 3.0) no longer store summary data in TSIDX file on search head, please see Splunk’s deployment planning documentation for updates to these numbers as they can vary at times.
-
These numbers should be considered the absolute maximum an Indexer can do under ideal circumstances.
-
Adding search load or app load to a distributed Splunk install will dramatically reduce the amount of indexed data per data that can be searched effectively.
-
Recommended Splunk Enterprise sizing: 150GB/day per Indexer.
- Add Indexers when volume reaches 200GB/day/Indexer
-
Recommended Splunk Enterprise Security sizing: 60GB/day per Indexer.
- Add indexers when volume reaches 80GB/day/Indexer
-
-
-
Splunk doesn’t prescribe exactly what hardware you must purchase; however, you should read through the following documentation to better understand their minimum specs:
-
High-Level System Requirements
-
Hardware Capacity Planning
-
-
CPU Spec. CPU is somewhat varied depending on what component you are talking about. For indexers, the current sweet spot for servers has been 12-16 core machines (I.e. dual socket six or eight core CPUs). Splunk can work with either AMD or Intel architecture on x86 systems, but is typically run on Intel hardware.
-
Memory Spec. Memory is somewhat varied depending on what component you are talking about. Generally speaking indexers do particularly well with 16+ GB of memory, meanwhile other components might require less.
-
Enterprise Security’s search load can apply more memory pressure. With that in mind, 24GB+ of memory on Indexers running ES is recommended.
-
Splunk takes advantage of file system caching provided with most modern Linux distributions, so adding memory can provide a great benefit.
-
-
Scale by adding more Indexers. In a well-configured distributed Splunk environment, you can scale simply by adding more indexers. The Universal Forwarders can forward data to the new indexer, and your search heads will request data from the new indexer. Generally speaking, this scales linearly resulting in a situation where double the indexers will cut search time in half.
-
Methodically plan storage needs for a new deployment, prior to implementation.
-
A useful, interactive Splunk sizing site.
-
Splunk’s documentation on sizing.
-
-
Storage Hardware.
-
Hard drive speed makes a difference. Splunk has informally documented that an increase in drive-speed will have a dramatic improvement on performance.
-
Solid state drives can result in a massive speedup in very specific use cases. Be aware of the cost per GB tradeoffs for the speed. Solid state drives provide the largest speedups in the “needle in a hay stack” use case. Solid state drives do not provide much performance in dense searches (high event counts).
- Consider the trade off of having less total hot storage that is faster versus more total hot storage that is slower in some uses cases. What will your typical search period be? Your hot volume should cover that, with a little bit of breathing room.
-
-
Distributed Architecture. Carefully plan Splunk Distributed Architecture to ensure the most accurate and efficient processing.
-
RAID Level. Use RAID1+0 whenever possible for the Splunk datastore. Little impact will be seen at low volumes; however, at higher data volumes you will see performance improvement with RAID1+0 over RAID 5 or 6.
-
Benchmark storage. Splunk recommends 800 IOPS (Input/Outputs Per Second) or better on your storage tier. This should be considered the minimum. Splunk will benefit greatly from increased disk performance above the 800 IOPs minimum. To get this performance, you will need to be using fast drives in an optimal RAID configuration served by an efficient controller (either internal, DAS, or SAN). There are various ways to test your storage to benchmark your current values, but the mostly commonly used method is via the venerable tool bonnie++ found in the repository of every major Linux distribution. There are many online guides (even on Splunk’s site) for how to run this tool; however, below is the gist:
-
Ensure the target drive to be tested (e.g. /splunk_hot) is mounted and relatively not in use (meaning stop Splunk if it is running). You want to not use it in order to get an accurate reading from bonnie++ without competing for resources with it.
-
Next, run the bonnie++ command against the target drive, with a “-s” option equal to 3-10x the amount of RAM you have in MB
bonnie++ -d /splunk_hot -s 264000 -u root:root -fb
-
-
-
If you choose to, you can pipe the above to one of these two commands (both come with bonnie++): bon_csv2html, bon_csv2txt
-
In the output, Random Seek/s = IOPs
-
Architecture type. Splunk should be run on 64 bit platforms. Although it is compatible with 32 bit platforms, it is strongly discouraged.
- Forwarders on 32 bit systems is perfectly acceptable.
-
-
Data Routing
Data routing allows the Splunk administrator to selectively determine what incoming data gets ingested, what gets forwarded, and what gets dropped.
-
Drop incoming data with the nullQueue. Beware not to go nullQueue-happy and drop too much. Many events while insignificant by themselves provide useful information when trended or otherwise analyzed.
- Data is often not considered security relevant at first, until there is a security incident related to the data. Consider this before dropping any data that could be useful in the future.
-
Forward to a Splunk system whenever possible, but if there is a Use Case to send to an external system, following these instructions to Forward data to third party systems. Beware there are some caveats of doing this.
-
Use Splunk AutoLB (Load Balancing) to distribute data to multiple indexers/forwarders. Much of this configuration must be done with the outputs.conf file. Note that Splunk 6.6 and higher no longer provide the option to turn off autolb.
Inputs
-
Ensure all critical systems have consistent time configuration. Systems generating events should have the proper time to ensure the events they create will be able to be correlated when analyzed. Consider NTP use throughout the enterprise as well as frequent time audits of the most critical systems to ensure accuracy.
- Consider doing regular time-audits. This is where you evaluate the time of your most critical systems to ensure they are consistent. If the data is in Splunk, then this task might just take a few minutes every month or so and is well worth it. The data onboarding app mentioned above provides dashboards to assist with this.
-
Explicitly configure Splunk to read time stamp information from incoming events. Splunk’s reads the time stamp from incoming events, which it then associates to the event in the index and the underlying buckets. It is imperative that time stamps and timezone offsets be parsed and set correctly both for usability and efficiency purposes.
-
Test new inputs. When new inputs will be created, test the data first by ingesting some of it and determine if it requires adjustments such as for time stamps, event-processing (such as breaking).
-
Syslog before Splunk. Traditional syslog technologies (syslogd, syslog-ng, rsyslogd) are simple and featureless compared to Splunk, but this is their advantage. Since these packages rarely change and require a small amount of resources, they are perfect for being the initial recipient of syslog data on the network. When network devices send syslog messages, this data is frequently UDP (connectionless) and therefore vulnerable in-transit. Even TCP syslog can be lost if the receiving host is unreachable. Place a syslog application (e.g. syslog-ng) on the network to receive the syslog feeds and configure the application to write the data out to files. Ideally, have the files be application-specific (e.g.
firewall.log,router.log,maillog.log, etc.). Splunk can be installed as a forwarder on the same host to read these files and forward them on. If Splunk requires a restart or is otherwise unavailable (i.e. during an upgrade), it can pick up where it left off reading the files on disk. Please see other recommendations for managing these files. -
Too many files. Ensure a single instance of Splunk does not monitor more than a few hundred active files. If there are more than this, consider implementing a process (i.e. cron) to move the previous day’s (or week perhaps) syslog directory out of the monitored directory-structure to an archive location. You know you have a problem with too many files if the Splunk instance involved has something like this in its logs: File descriptor cache is full. You might also benefit here by increasing the ulimit (see Adjust ulimit in this document).
-
Avoid overwriting or hard-coding the
sourcefield in the data. Doing so can make troubleshooting problematic inputs more difficult. -
A useful resource on Data on-boarding is the 2014 Splunk .Conf talk. Both the slides and a recording are available.
Syslog Input
- Strip priority out of TCP inputs. In accordance with RFC3164 a Syslog priority message is prepended to each syslog event. By default, Splunk will strip this out on incoming UDP see inputs.conf documentation regarding the
no_priority_strippingdirective. The problem is, that many devices still prepend this priority when sending events via TCP. Splunk expects the events to be RFC-compliant and not contain the priority so does not know to remove it. Here is an example of what an event looks like:
<30>Sep 29 09:41:51 192.168.250.7 named[19706]...
To strip this out, add the following to the appropriate stanza of the props.conf for the target sourcetype:
SEDCMD-pristrip=s/^<[0-9]+>//
- Watch out for chained syslog time stamps. If an event is relayed through multiple syslog servers (for example the local syslog on a Linux system sending events to a remote syslog server), there may be two time stamps at the start of the event. Carefully configure your Splunk props.conf to ensure the correct time stamp is extracted for the event.
High Performance Syslog
The Linux UDP input buffer has a fixed amount of memory allocated to it. When the amount of incoming data exceeds this buffer, packets are dropped. On a very busy server, this could happen frequently or in some cases continually.
The memory allocated to the UDP input buffer is distribution-specific. This means, that depending on your flavor/version of Linux, this buffer size can vary. Be sure to understand what it is, and how it operates. Syslog systems should be tested and tuned to perform as needed.
-
Calculate Capacity by Messages
-
Imagine a device that generates messages that are 250-450 bytes with most being over 350.
-
If we average conservatively that the messages are 400 bytes big, how many EPS could be processed before saturating half the link such as in the Syslog-NG Example below
-
A 100/mbs link is capable of 100000000/8=12500000 bytes/sec
-
Half of this is 6250000 (what the Syslog-ng folks could do)
-
Divide this by 400 (average bytes/message) and you get 15625 which is the total amount of messages we could possibly receive if optimally configured with tcp given the parameters.
-
Syslog-NG Example
-
The syslog-ng developers have a blog post where they discuss possible volumes with the 2.0 OSE:
-
100mbs net
-
TCP messages
-
44000 messages/sec all 150 bytes long
-
-
This means they are processing 44000*150=6600000 bytes per second
-
Multiply 6600000*8 to get bandwidth: 52,800,000
-
So syslog-ng optimally configured (by its developer) can use about half of the 100/mbs Ethernet connection without dropping packets
-
-
-
Calculate Capacity by License Size
-
Imagine a 50GB license
-
Divide by seconds per day 86400 to see an average of how much data could be pushed through the network on average:
- 50000000000/86400 = 578703 (bytes/second)
-
Multiply the above by 8 to get bits per bytes
- (50000000000/86400) * 8 = 4629624 (bits/second)
-
Application or Data Specific
-
SEP Data import. For Symantec Endpoint Protection, you can put the SEP server in a configuration where it will write out temp files that a Splunk Universal Forwarder can read. Here is the Symantec knowledge-base document on how to configure this. While it is possible to configure SEP to send data via syslog, in some cases this data is incomplete, and unreliable. Also be aware that there are significant differences in the event format of SEP events between versions (most notably versions 11 and 12), which may result in failed extraction of fields if your TA or current extractions are expecting a different version.
-
Avoid reading Windows raw EVT(X) files if at all possible. Instead, configure a Splunk Forwarder to access Windows Event Manager directly to ingest Windows Events.
-
If your use case requires direct reads of the Windows EVT(X) binary files then consider the following information:
-
EVT(X) files are the raw binary-format files that Windows uses to store its logs on the file-system. These files are nothing like normal log files and therefore present some challenges to any attempt to reconstitute them back into usable logs (Note: These issues have nothing to do with Splunk):
-
They reference GUID/SIDs in lieu of system/user names. This means that the “EVT(X) File Parsing Host” must have access to make AD queries to the Domain Controllers that can provide details and convert the codes referenced by the “Logging Host.”
-
They reference DLL files that contain the pertinent information instead of placing it in the actual log. This means any DLL referenced by the “Logging Host” MUST be available on the “EVT(X) File Parsing Host” in order to interpret the logs.
-
Since the EVT(X) files are a subset of the information they represent, a 99MB EVTX file converts to almost 500MB of indexed data. There are TB of logs stored on the CIFS share. The volume both to the Splunk license, system storage, and AD/DC calls should be considered before fully-integrating this.
-
Ingest time is slow since many AD calls are necessary for GUID/SID queries.
-
In our tests, many GUIDs and some DLL references didn’t convert in the event logs, leaving lots of useless events. This may be a result of either inconsistent AD details or missing DLLs on the “Log Parsing Host”
-
Splunk on Windows can natively ingest EVT(X) files
-
-
-
Splunk Enterprise Security
-
Implementation
-
Adjust VM Swap. Lower the
vm.swappinessinsysctlto something like:vm.swappiness=10 -
Adjust ulimit. Adjust the ulimit if necessary such as:
# /etc/pam.d/su session required pam_limits.so # /etc/pam.d/sudo session required pam_limits.so # Query file descriptor settings cat /proc/sys/fs/file-max sysctl -a | grep fs.file-max # Query open file descriptors cat /proc/sys/fs/file-nr # Configure System limits in /etc/sysctl.conf fs.file-max = 8192 #/etc/security/limits.conf root soft nofile 10240 root hard nofile 20240 splunk soft nofile 10240 splunk hard nofile 20240 # #/etc/security/limits.d/{20,90}-nproc.conf # Centos 7.1 user default is 4096 splunk soft nofile 10240 # Centos 7.1 Default root soft nproc unlimited- Apply changes to sysctl with
sysctl -p
-
-
Apply changes to limits.conf by logging out and logging in again
-
Administration
-
Manage Assets Lists. Continue to manage your ES Asset List to always get the most value out of your deployment.
-
Manage Identities. Manage your ES Identities to always get the most value out of your deployment.
-
-
Forwarder Deployment
Change the admin password on forwarders. All Splunk systems have a default username of admin and password of changeme and this includes Forwarders (Universal Forwarders and Full Forwarders). Note that after Splunk 7.1, no password is set by default.
-
Take time to plan your deployment prior to implementation to ensure the most success.
-
Centrally-manage Splunk configurations. Ensure you have a way to consistently and accurately manage configurations across the enterprise, such as with the Splunk deployment server
-
Information: Topologies for Deployment Server
-
Information: Create Server Classes
-
Information: Configure Deployment Clients
-
Information: Deploy Deployment Apps
-
Information: Deployment Example
-
Windows Deployment
-
Information: Custom EventLogs on Splunk for Windows are discussed here.
-
Information: Splunk has the ability to use WMI to monitor Eventlogs remotely. WMI is very clunky, and generally should not be used due to network and system performance implications.
-
Before activating Splunk Windows Forwarders configure custom indexes
-
Information: Monitor files and directories
-
Scripted deployment for Windows UFs. You can script your deployment of Universal Forwarders for Windows depending on what tools you have available at your disposal. There are a few things to keep in mind though such as:
- On a version with UAC (User Access Controls) such as Visa, 2008 or Windows 7, you must be in an admin shell to install software
-
Although it is much easier to have the Splunk MSI files in a UNC that you can mount/reach from any system, sometimes windows security policy prevents this from working. If msiexec is failing consider copying the MSI installer local and try it again.
-
There are a few things to keep in mind though, specifically that you want to pass the following msiexec arguments:
AGREETOLICENSE,INSTALLDIR(since many sites want to install to some drive besides c ) -
Below is an example content that you can put in a script/package-management and it is based on having a Splunk deployment server in place
msiexec /i \\system\share\path\splunkforwarder-6.2* DEPLOYMENT_SERVER="DS-host_or_IP:8089" \ AGREETOLICENSE=Yes INSTALLDIR="c:\Program Files\SplunkUniversalForwarder" MIGRATESPLUNK=1 \quiet
- A complete list of supported MSIEXEC flags.
Linux Deployment
-
Scripted deployment for Linux UFs. You can script your deployment of Universal Forwards for Linux depending on what tools you have available at your disposal.
-
There are a few things to keep in mind though, specifically that you probably want to pass the following Splunk start-time arguments:
–accept-license,–answer-yes,–no-prompt -
Below is an example content that you can put in a script/puppet/rpm and it is based on having a Splunk deployment server in place.
This hard-codes a download of the Splunk UF RPM at each invocation. It would be much smarter to use a local repo and replace that portion of the script with a call to this location with something simple like: yum install splunkforwarder
  uname -a
  echo
  SPLUNKHOME="/opt/splunkforwarder"
  wget -O splunkforwarder-6.2.4-271043-linux-2.6-x86_64.rpm 'http://www.splunk.com/bin/splunk/DownloadActivityServlet?architecture=x86_64&platform=Linux&version=6.2.4&product=universalforwarder&filename=splunkforwarder-6.2.4-271043-linux-2.6-x86_64.rpm&wget=true';
  echo -e '[target-broker:deploymentServer]\ntargetUri = SPLUNK.DEPLOYMENT.SERVER.HOSTNAME_or_IP:8089' > $SPLUNKHOME/etc/system/local/deploymentclient.conf;
  $SPLUNKHOME/bin/splunk restart --accept-license --answer-yes --no-prompt;
  $SPLUNKHOME/bin/splunk enable boot-start;
  [ -f "$SPLUNKHOME/etc/system/local/outputs.conf" ] && mv $SPLUNKHOME/etc/system/local/outputs.conf $SPLUNKHOME/etc/system/local/outputs.conf.remove;
  [ -f "$SPLUNKHOME/etc/system/local/outputs.conf.remove" ] && $SPLUNKHOME/bin/splunk restart;
  sleep 3
  watch "ls $SPLUNKHOME/etc/apps"
  echo
Performance
-
Lots of things can affect Splunk performance, including: System resources, Splunk architecture, Splunk configurations (e.g. lookups, extractions), and dashboards.
-
Before attempting any performance remedies, first try and determine what may be adversely affecting your deployment’s performance.
-
UI Performance Remedies
- Use Summary Indexing for increased reporting efficiency. As you add more data and more users to Splunk, you will benefit from Summary Indexing.
-
As of Splunk 5, it is also possible to use report acceleration. Not all searches qualify for acceleration.
-
As of Splunk 6, it is also possible to use data model acceleration. Any pivot or report generated by that data model will complete much quicker than it would without the acceleration, even if the data model represents a significantly large dataset.
-
Linux Kernel Tuning Info
-
Implement a central software management system (e.g. RPM repo, Puppet, Satellite Server) to manage packages and configurations to forwarders and other related systems. Managing Splunk instances on these remote systems always has problems and leads to issues such as:
- Very old (out of date) versions of Splunk throughout the enterprise
-
Forwarders that have not had Splunk configured properly or locked down (e.g. changing the admin password and turning off Splunk web)
-
Inconsistent configurations leading to similar systems setting different metadata on the same type of logs.
-
Architecture type. Splunk works well with both 32 and 64 bit platforms; however, there is a considerable performance improvement for 64 bit and this should be selected (both for Hardware and Operating System) whenever possible.
-
Partitions and Volumes
- Use LVM to manage underlying file-system space. Only allocate storage space to an LVM from a Volume Group as necessary and preserve the extra for emergencies or future use. Make better use of LVM partitioning by creating discrete logical volumes for each major portion of the system such as
/,/var,/tmp,/opt/splunkand maybe even/splunkdata
- Use LVM to manage underlying file-system space. Only allocate storage space to an LVM from a Volume Group as necessary and preserve the extra for emergencies or future use. Make better use of LVM partitioning by creating discrete logical volumes for each major portion of the system such as
-
Search Help
-
Print the Splunk Cheatsheet (PDF) for users. This is a great resource for learning the search language. The Splunk Reference Card PDF is also a great resource, and a laminated version can be purchased from the Splunk Schwag store.
-
Consider taking a Splunk EDU class. Splunk has multiple classes focusing on search and dashboarding.
Storage and Data Management
-
New Index. It is almost always appropriate to use multiple indexes and not just
main. -
Create a new index if the answer of any of the following questions is yes:
-
Does the target data require separate retention controls from other data?
-
Does the target data require separate access controls from other data?
-
Will Splunk users wish to either search the target data by itself or search other data and omit this target data?
-
-
Consider moving your Splunk database (
SPLUNKDB) to its own volume to ensure clean separation of the binary/configuration structure and the data. This is not necessary, but there are advantages in high-volume environments. -
Data retention. Implement data retention and disk usage controls explicitly and early instead of waiting for a disk to fill. Configure retention in indexes.conf to push older data to remote volumes such as NFS mount for data archive.
Changes to the retention policy (indexes.conf) can be perilous and the effect is not always immediate. Be sure you know what you are changing and have tracked changes and the results appropriately to ensure it has the desired effect.
-
DRP/BCP. Configure a Disaster Recovery and Business Continuity Plan for your Splunk deployment. This will include implementing a backup plan.
-
Consider backups for the $SPLUNK_HOME/etc on each standalone search head (non-pooled) and the cluster node to a remote drive on a frequent interval. If an unmentionable happened, you can copy this directory to a new Splunk instance to restore. (sample script below to put in cron.daily or weekly)
-
Backup the master node, the /$SPLUNK_HOME/etc/master-apps directory to a remote drive is recommended to quickly build a new master node. (sample script below to put in cron.daily or weekly)
#!/bin/sh

TSTAMP=`date +%Y%m%d01`
BAKBASE="/root/splunk/backup"
[ ! -d "$BAKBASE" ] && mkdir -p "$BAKBASE"
i#
cd /opt/splunk/etc
tar czpf $BAKBASE/master-apps.$TSTAMP.tar.gz master-apps

exit 0
- Backup the deployment server, the $SPLUNK_HOME/etc/system/local/serverclass.conf and the /$SPLUNK_HOME/etc/deployment-apps directory to a remote drive is recommended to quickly build a new deployment server. (sample script below to put in cron.daily or weekly)
#!/bin/sh

TSTAMP=`date +%Y%m%d01`
BAKBASE="/root/splunk/backup"
[ ! -d "$BAKBASE" ] && mkdir -p "$BAKBASE"
i#
cd /opt/splunk/etc
tar czpf $BAKBASE/deployment-apps.$TSTAMP.tar.gz system/local/serverclass.conf deployment-apps

exit 0
- See the “Storage Hardware” section in this document for many notes regarding hardware.
Deployment Server
-
Deployment Server Selection
-
The DS can be collocated with any other full Splunk instance; however, there are also some reasons why it might need to be stand-alone.
-
Since the DS requires so many active TCP sessions (at least one for each connected client), choose a system that already has a limited number of open TCP sessions to other systems, such as a Search Head.
-
Ensure the DS server has plenty of memory.
-
Consider a stand-alone system if the number of deployment-clients will exceed 300-500
-
Consider one Deployment Server instance for every 2000 polls per minute.
-
Create a DNS host name specific to the DS (e.g. splunk-ds.yourfoo.fqdn) and use this name for all communication from the deployment-clients. This will make it much easier to migrate later, if you choose to.
-
Adjust the polling period on clients to make a single server scale further.
-
-
Use the clientName directive in the deploymentclient.conf to ease whitelisting and blacklisting in your serverclass.conf
-
Only deploy configuration and parsing apps, such as Technology Addons (TA’s). There is very little value in deploying dashboard based apps, and in some cases may cause complications.
-
Prepend deployed configuration apps (not TA’s) with “DS-“. This distinction can help tremendously when troubleshooting problems with deployment clients.
App Development
-
Ensure all (if possible) searches call saved searches or use other knowledge-items such as Macros or Eventtypes. Containing all of these knowledge-items helps with manageability of the data across an enterprise deployment. Managing bare searches across apps or called externally via scripts does not scale well and can create a big problem during upgrades, migrations, and other maintenance.
-
When creating fields/eventtypes refer to the Splunk Common Information Model to ensure forward-compatibility with Splunk and Splunkbase built-ins.
-
When developing an app, ensure that any log or pid files are not stored in the app’s directory. If the app is distributed via deployment server, the files and directory structure in the app will be replaced with those from the deployment server, which would include any log or pid files.
Analytics
-
Aplura’s PAVO Security apps has dashboards to cover major security domains.
-
Use GetWatchList. GetWatchList is a free Splunk app on Splunkbase that allows users to manage lookup tables on the system without requiring shell or administrative access. These lookups can be used in various ways but the most popular method is as watchlistsOS Configuration or Hardening
-
Enterprise Security has many useful dashboards for various protocols.